
用最小二乘法出来结果是这样的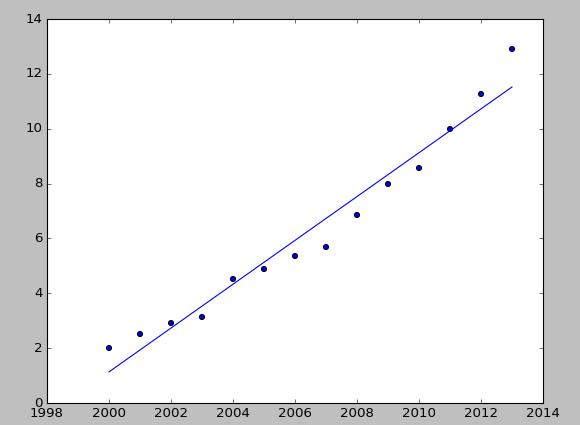
相应的cost function 是2.9
梯度下降就成这样了。。。。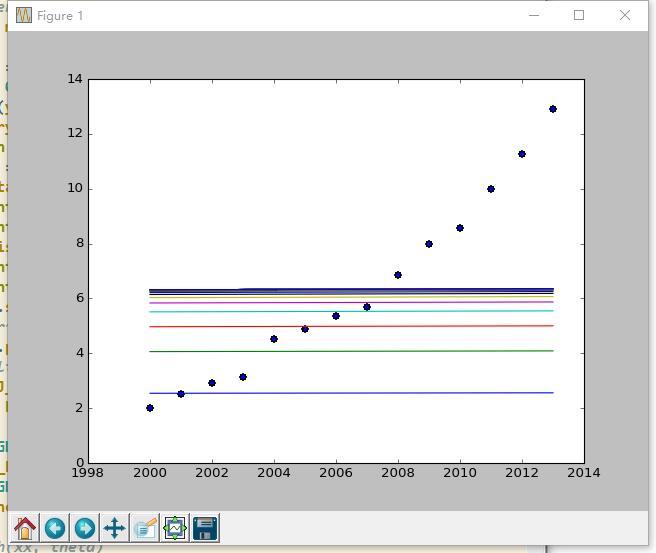
线的轨迹是从下到上,到中间基本就不怎么动了
cost function 到74.9左右变化就很小
代码如下:
import pandas as pd
from numpy import *
import matplotlib.pyplot as plt

year = [2000, 2001, 2002, 2003, 2004, 2005, 2006, 2007, 2008,
2009, 2010, 2011, 2012, 2013]
price = [2.000, 2.500, 2.900, 3.147, 4.515, 4.903, 5.365, 5.704,
6.853, 7.971, 8.561, 10.000, 11.280, 12.900]
m = len(year)

# initialize
xx = mat(array(year))
xx = xx.T
x0 = mat(ones((m, 1)))
# print x0
xx = hstack((x0, xx))
# print xx

yy = mat(array(price))
yy = yy.T
# # xx is m*2 matrix
# # yy is m*1

# Hypothesis
def h(vx, theta):
    return vx * theta

# Cost function
def J(theta, vx, vy):
    J = float((vx * theta - vy).T * (vx * theta - vy)) / 2
    return J

# Gradient Descent
theta = mat([0, 0]).T

n_iters = 99
alpha = 0.0000001

J_history = mat(ones((n_iters, 1)))
for i in range(n_iters):
    err = xx * theta - yy
    theta = theta - alpha/m * xx.T * err
    J_history[i, :] = J(theta, xx, yy)
    print(J_history[i, :])
    print("\n")
    plt.scatter(year, price)
    plt.plot(year, xx * theta)

print("GD over\n\n\n")
print(J_history)
print("GD over\n\n\n")
print(theta.T)
plt.show()

