所属分类:网页特效-表格


<script type="text/javascript" src="js/jquery-1.4.2.min.js" ></script>
<script type="text/javascript" src="js/highcharts.js" ></script>var chart;
$(function() {
chart = new Highcharts.Chart({
chart: {
renderTo: 'chart_combo' //关联页面元素div#id
},
title: { //图表标题
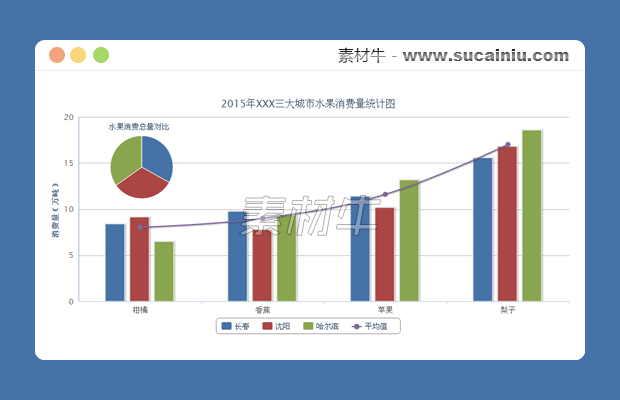
text: '2015年XXX三大城市水果消费量统计图'
},
xAxis: { //x轴
categories: ['柑橘', '香蕉','苹果', '梨子'], //X轴类别
labels:{y:18} //x轴标签位置:距X轴下方18像素
},
yAxis: { //y轴
title: {text: '消费量(万吨)'}, //y轴标题
lineWidth: 2 //基线宽度
},
tooltip: {
formatter: function() { //格式化鼠标滑向图表数据点时显示的提示框
var s;
if (this.point.name) { // 饼状图
s = '<b>' + this.point.name + '</b>: <br>' + this.y+ '万吨(' + twoDecimal(this.percentage) + '%)';
} else {
s = '' + this.x + ': ' + this.y + '万吨';
}
return s;
}
},
labels: { //图表标签
items: [{
html: '水果消费总量对比',
style: {
left: '48px',
top: '8px'
}
}]
},
exporting: {
enabled: false //设置导出按钮不可用
},
credits: {
text: '#',
href: '#'
},
series: [{ //数据列
type: 'column',
name: '长春',
data: [8.4, 9.8, 11.4, 15.6]
},
{
type: 'column',
name: '沈阳',
data: [9.2, 7.8, 10.2, 16.8]
},
{
type: 'column',
name: '哈尔滨',
data: [6.5, 9.4, 13.2, 18.6]
},
{
type: 'spline',
name: '平均值',
data: [8.03, 9, 11.6, 17]
},
{
type: 'pie', //饼状图
name: '水果消费总量',
data: [{
name: '长春',
y: 45.2,
color: '#4572A7'
},
{
name: '沈阳',
y: 44,
color: '#AA4643'
},
{
name: '哈尔滨',
y: 47.7,
color: '#89A54E'
}],
center: [100, 80], //饼状图坐标
size: 100, //饼状图直径大小
dataLabels: {
enabled: false //不显示饼状图数据标签
}
}]
});
});
//保留2位小数
function twoDecimal(x) {
var f_x = parseFloat(x);
if (isNaN(f_x)) {
alert('错误的参数');
return false;
}
var f_x = Math.round(x * 100) / 100;
var s_x = f_x.toString();
var pos_decimal = s_x.indexOf('.');
if (pos_decimal < 0) {
pos_decimal = s_x.length;
s_x += '.';
}
while (s_x.length <= pos_decimal + 2) {
s_x += '0';
}
return s_x;
}<div id="chart_combo" class="chart_combo"></div>