所属分类:网页特效-表格

var config = {
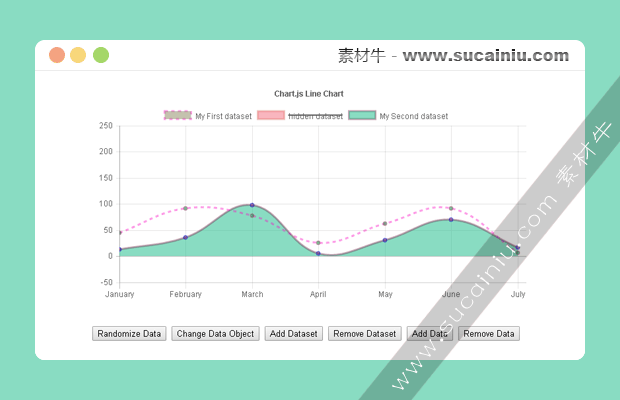
type: 'line',
data: {
labels: ["January", "February", "March", "April", "May", "June", "July"],
datasets: [{
label: "My First dataset",
data: [randomScalingFactor(), randomScalingFactor(), randomScalingFactor(), randomScalingFactor(), randomScalingFactor(), randomScalingFactor(), randomScalingFactor()],
fill: false,
borderDash: [5, 5],
}, {
hidden: true,
label: 'hidden dataset',
data: [randomScalingFactor(), randomScalingFactor(), randomScalingFactor(), randomScalingFactor(), randomScalingFactor(), randomScalingFactor(), randomScalingFactor()],
}, {
label: "My Second dataset",
data: [randomScalingFactor(), randomScalingFactor(), randomScalingFactor(), randomScalingFactor(), randomScalingFactor(), randomScalingFactor(), randomScalingFactor()],
}]
},
options: {
responsive: true,
title: {
display: true,
text: 'Chart.js Line Chart'
},
tooltips: {
mode: 'label',
callbacks: {
// beforeTitle: function() {
// return '...beforeTitle';
// },
// afterTitle: function() {
// return '...afterTitle';
// },
// beforeBody: function() {
// return '...beforeBody';
// },
// afterBody: function() {
// return '...afterBody';
// },
// beforeFooter: function() {
// return '...beforeFooter';
// },
// footer: function() {
// return 'Footer';
// },
// afterFooter: function() {
// return '...afterFooter';
// },
}
},
hover: {
mode: 'dataset'
},
scales: {
xAxes: [{
display: true,
scaleLabel: {
show: true,
labelString: 'Month'
}
}],
yAxes: [{
display: true,
scaleLabel: {
show: true,
labelString: 'Value'
},
ticks: {
suggestedMin: -10,
suggestedMax: 250,
}
}]
}
}
};
$.each(config.data.datasets, function(i, dataset) {
dataset.borderColor = randomColor(0.4);
dataset.backgroundColor = randomColor(0.5);
dataset.pointBorderColor = randomColor(0.7);
dataset.pointBackgroundColor = randomColor(0.5);
dataset.pointBorderWidth = 1;
});